Pushing the limit of logP prediction accuracy: Chemaxon’s results for the SAMPL 6 blind challenge
SAMPL (Statistical Assessment of the Modeling of Proteins and Ligands) challenges are designed to benchmark the accuracy of biomolecular and physical modeling for rational drug design. The previously published SAMPL 6 assessment focused on the prediction of octanol-water partitioning coefficients (log P). 91 predictions were submitted from 17 research groups against the 11 compounds of this blind challenge applying quantum-mechanics (QM), molecular mechanics (MM), knowledge-based, empirical or mixed methods. Among them, numerous highly accurate methods were identified: 10 diverse methods achieved RMSE less than 0.5 log P units. Based on the most accurate five submission, the accuracy order of the approaches was found to be MM-based, mixed, QM-based and empirical with the following RMSE values: 0.92±0.13, 0.50±0.06, 0.48±0.06, and 0.47±0.05, respectively.
Inspired by the findings of SAMPL 6, we have recently checked Chemaxon’s empirical log P prediction accuracy on this relatively small, but accurately measured dataset. The Chemaxon logP method is an improved implementation of the atomic log P increments approach, originally published by Viswanadhan et al. with significant proprietary extensions. JChem Base version 19.2 (released on 23th of January, 2019, well before the submission deadline of SAMPL 6) cxcalc command line tool was used for log P prediction with the Chemaxon method option: “cxcalc logp -m chemaxon logp_sampl6.sdf”. Results were analyzed by the original scripts, simulating a post-deadline submission from Chemaxon (CXN).
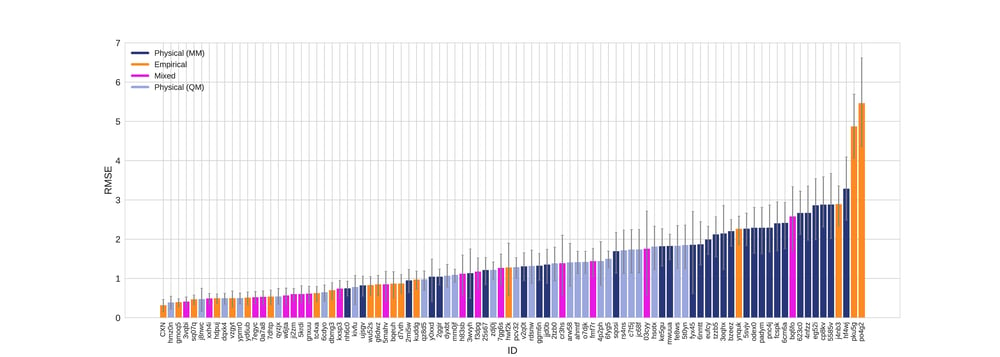
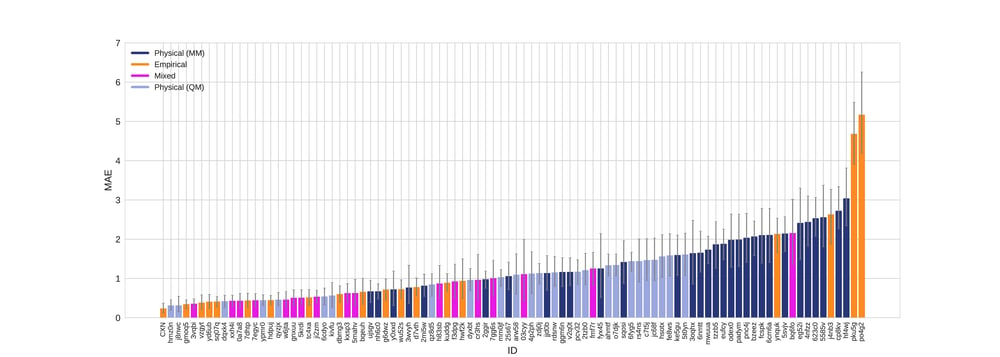
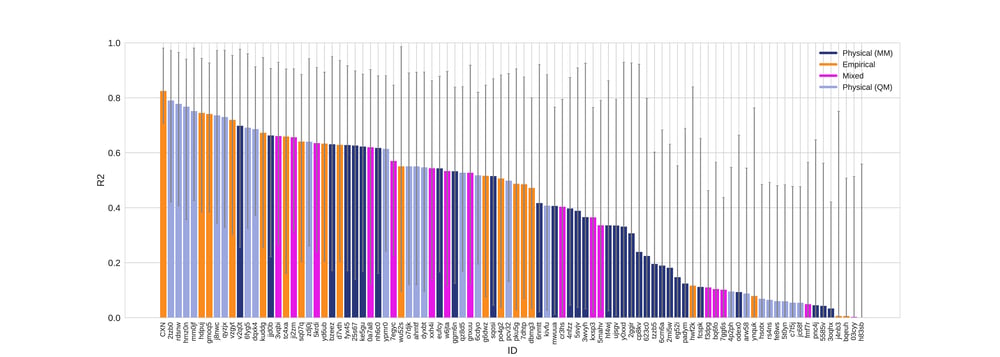
According to all metrics evaluated by the SAMPL 6 challenge, the Chemaxon log P was found to yield the highest accuracy with 0.31 RMSE (Fig 1.), 0.23 mean absolute error (MAE, Fig 2.), -0.02 mean error (ME), 0.82 coefficient of determination (R2, Fig 3.) , and 0.95 Kendall tau. Moreover, the 95% confidence intervals that were generated by bootstrapping over challenge molecules yielded reasonably narrow ranges.
Figure 1. RMSE values colored by method type with error bars denoting 95% confidence intervals obtained by bootstrapping over challenge molecules.
Figure 2. Mean absolute error colored by method type with error bars denoting 95% confidence intervals obtained by bootstrapping over challenge molecules.
Figure 3. R2 values colored by method type with error bars denoting 95% confidence intervals obtained by bootstrapping over challenge molecules..
The SAMPL 6 data set contained calculated values from 3 commercial vendors as reference calculation including MOE, MoKa and BioByte (Table 1.). The CXN results on this blind challenge outperformed the selected references. CXN showed low mean error (-0.025) and high R2 (0.825) indicating that the predictions are not containing bias or offset.
Table 1. Results for reference calculations.
| ID | Name | MAE | RMSE | ME | R2 | kendall_tau |
|---|---|---|---|---|---|---|
| CXN | ChemAxon | 0.232 | 0.314 | -0.025 | 0.825 | 0.855 |
| REF11 | logP(o/w) (MOE) | 0.388 | 0.543 | 0.190 | 0.587 | 0.673 |
| REF13 | SlogP (MOE) | 0.473 | 0.552 | -0.273 | 0.686 | 0.600 |
| REF12 | MoKa_logP | 0.520 | 0.597 | -0.082 | 0.665 | 0.550 |
| REF10 | h_logP (MOE) | 0.507 | 0.605 | -0.044 | 0.377 | 0.345 |
| NULL0 | mean clogP of FDA approved oral drugs (1998-2017) |
0.660 | 0.789 | 0.422 | 0.000 | - |
| REF09 | clogP (Biobyte) | 0.683 | 0.822 | -0.257 | 0.463 | 0.477 |
A closer analysis of results for each individual compound revealed that >0.5 absolute error was found only in 1 out of the 11 cases (Fig 4-5.), the SM11. This molecule was found to have the highest average error for empirical methods, see Figure 7. B in the original publication, therefore it represents a complex case for this modelling technique. This example calls for further investigation and optimization.
In summary, the Chemaxon log P calculation resulted in high accuracy on never-seen molecules of the SAMPL 6 challenge. This finding underlines that the model has general prediction power, therefore it can contribute to the optimization of novel molecules or experimental conditions throughout the drug discovery projects.
Assess the log P accuracy of your molecules and design the next generation of compounds through wide array of options form the Chemaxon portfolio:
Interactive user interfaces:
Marvin Sketch with desktop sketcher
Integrations:
Chemicalize Pro API as a service
JChem: Microservices, Command Line Interface, Java API, .Net API and SQL cartridges
JChem for Office: MS Office add-on
Workflow tools (KNIME, Pipeline Pilot)
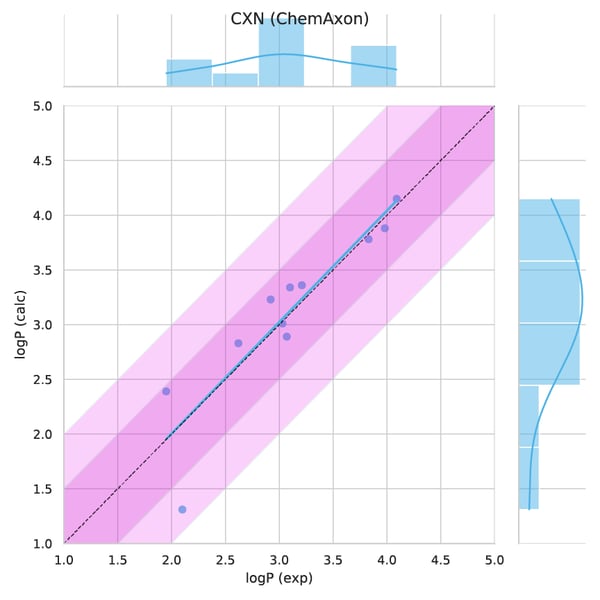
Figure 4. Observed versus predicted values.
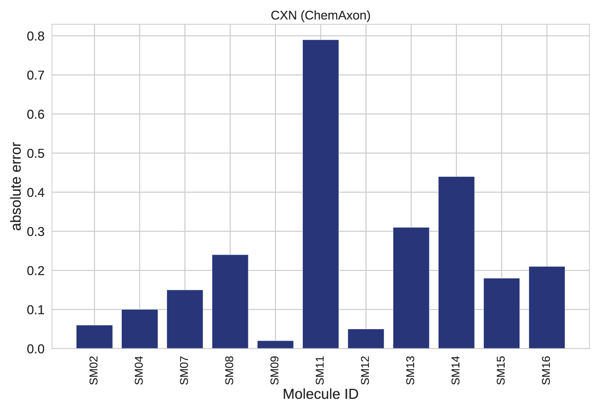
Figure 5. Absolute error per molecule.
